Tidy Tuesday Exercise 2

Load Packages

library(tidyverse)
── Attaching packages ─────────────────────────────────────── tidyverse 1.3.2 ──
✔ ggplot2 3.4.0      ✔ purrr   1.0.1 
✔ tibble  3.1.8      ✔ dplyr   1.0.10
✔ tidyr   1.2.1      ✔ stringr 1.5.0 
✔ readr   2.1.3      ✔ forcats 0.5.2 
── Conflicts ────────────────────────────────────────── tidyverse_conflicts() ──
✖ dplyr::filter() masks stats::filter()
✖ dplyr::lag()    masks stats::lag()
library(tidymodels)
── Attaching packages ────────────────────────────────────── tidymodels 1.0.0 ──
✔ broom        1.0.2     ✔ rsample      1.1.1
✔ dials        1.1.0     ✔ tune         1.0.1
✔ infer        1.0.4     ✔ workflows    1.1.2
✔ modeldata    1.0.1     ✔ workflowsets 1.0.0
✔ parsnip      1.0.3     ✔ yardstick    1.1.0
✔ recipes      1.0.4     
── Conflicts ───────────────────────────────────────── tidymodels_conflicts() ──
✖ scales::discard() masks purrr::discard()
✖ dplyr::filter()   masks stats::filter()
✖ recipes::fixed()  masks stringr::fixed()
✖ dplyr::lag()      masks stats::lag()
✖ yardstick::spec() masks readr::spec()
✖ recipes::step()   masks stats::step()
• Learn how to get started at https://www.tidymodels.org/start/
library(rpart)
Warning: package 'rpart' was built under R version 4.2.3

Attaching package: 'rpart'

The following object is masked from 'package:dials':

    prune
library(ranger)
Warning: package 'ranger' was built under R version 4.2.3
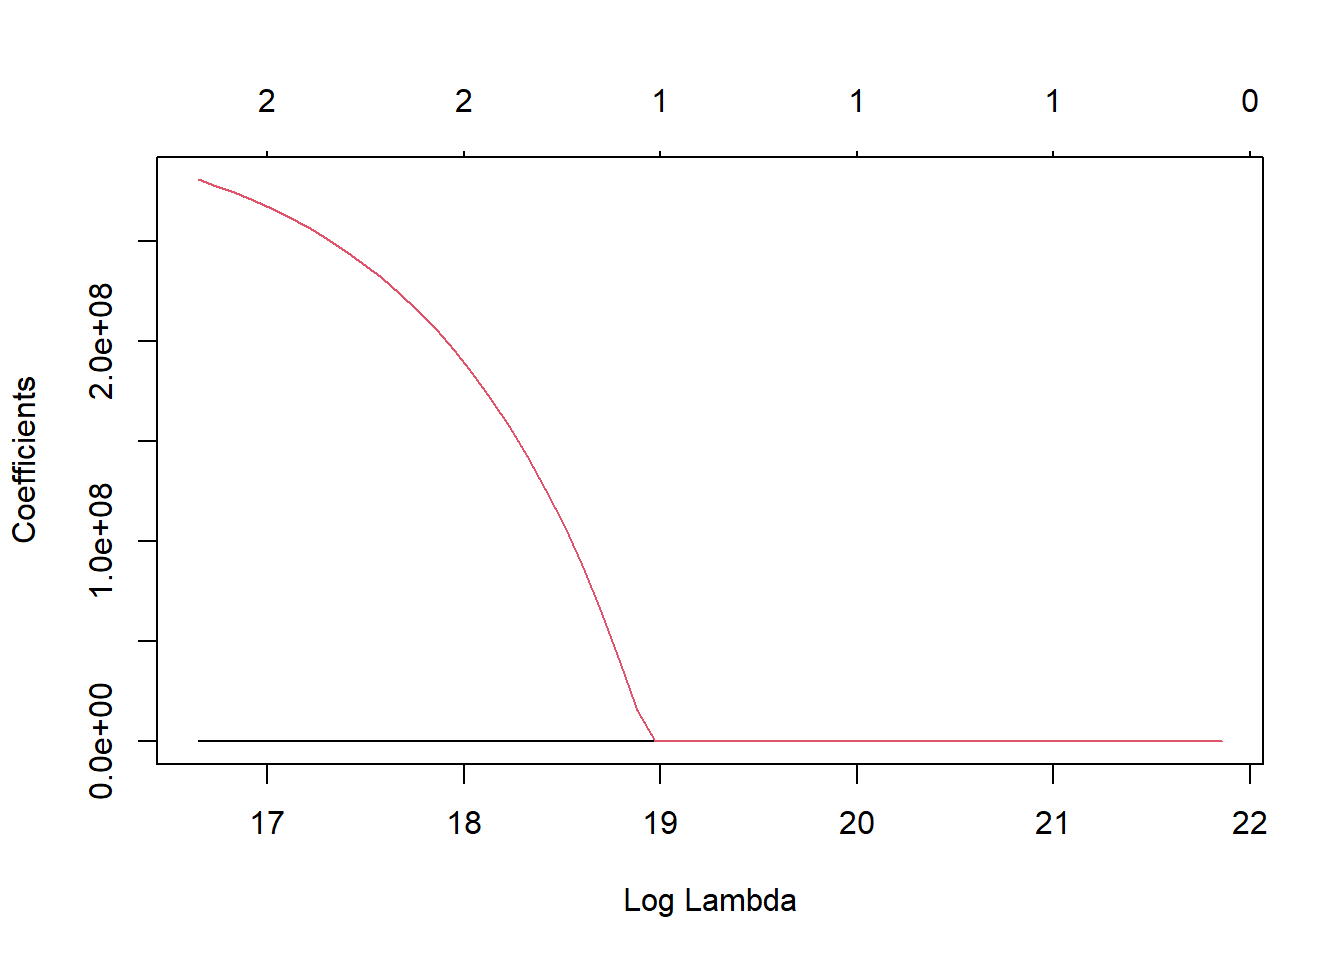
library(glmnet)
Warning: package 'glmnet' was built under R version 4.2.3
Loading required package: Matrix

Attaching package: 'Matrix'

The following objects are masked from 'package:tidyr':

    expand, pack, unpack

Loaded glmnet 4.1-7
library(rpart.plot)
Warning: package 'rpart.plot' was built under R version 4.2.3
library(vip)
Warning: package 'vip' was built under R version 4.2.3

Attaching package: 'vip'

The following object is masked from 'package:utils':

    vi

Load Data

egg  <- readr::read_csv('https://raw.githubusercontent.com/rfordatascience/tidytuesday/master/data/2023/2023-04-11/egg-production.csv')
Rows: 220 Columns: 6
── Column specification ────────────────────────────────────────────────────────
Delimiter: ","
chr  (3): prod_type, prod_process, source
dbl  (2): n_hens, n_eggs
date (1): observed_month

ℹ Use `spec()` to retrieve the full column specification for this data.
ℹ Specify the column types or set `show_col_types = FALSE` to quiet this message.
cage <- readr::read_csv('https://raw.githubusercontent.com/rfordatascience/tidytuesday/master/data/2023/2023-04-11/cage-free-percentages.csv')
Rows: 96 Columns: 4
── Column specification ────────────────────────────────────────────────────────
Delimiter: ","
chr  (1): source
dbl  (2): percent_hens, percent_eggs
date (1): observed_month

ℹ Use `spec()` to retrieve the full column specification for this data.
ℹ Specify the column types or set `show_col_types = FALSE` to quiet this message.

Data Exploration and Cleaning

# getting an idea of the dimensions and classes of data
glimpse(egg)
Rows: 220
Columns: 6
$ observed_month <date> 2016-07-31, 2016-08-31, 2016-09-30, 2016-10-31, 2016-1…
$ prod_type      <chr> "hatching eggs", "hatching eggs", "hatching eggs", "hat…
$ prod_process   <chr> "all", "all", "all", "all", "all", "all", "all", "all",…
$ n_hens         <dbl> 57975000, 57595000, 57161000, 56857000, 57116000, 57750…
$ n_eggs         <dbl> 1147000000, 1142700000, 1093300000, 1126700000, 1096600…
$ source         <chr> "ChicEggs-09-23-2016.pdf", "ChicEggs-10-21-2016.pdf", "…
glimpse(cage)
Rows: 96
Columns: 4
$ observed_month <date> 2007-12-31, 2008-12-31, 2009-12-31, 2010-12-31, 2011-1…
$ percent_hens   <dbl> 3.20000, 3.50000, 3.60000, 4.40000, 5.40000, 6.00000, 5…
$ percent_eggs   <dbl> NA, NA, NA, NA, NA, NA, NA, NA, NA, NA, 9.634938, NA, 9…
$ source         <chr> "Egg-Markets-Overview-2019-10-19.pdf", "Egg-Markets-Ove…
summary(egg)
 observed_month        prod_type         prod_process           n_hens         
 Min.   :2016-07-31   Length:220         Length:220         Min.   : 13500000  
 1st Qu.:2017-09-30   Class :character   Class :character   1st Qu.: 17284500  
 Median :2018-11-15   Mode  :character   Mode  :character   Median : 59939500  
 Mean   :2018-11-14                                         Mean   :110839873  
 3rd Qu.:2019-12-31                                         3rd Qu.:125539250  
 Max.   :2021-02-28                                         Max.   :341166000  
     n_eggs             source         
 Min.   :2.981e+08   Length:220        
 1st Qu.:4.240e+08   Class :character  
 Median :1.155e+09   Mode  :character  
 Mean   :2.607e+09                     
 3rd Qu.:2.963e+09                     
 Max.   :8.601e+09                     
summary(cage)
 observed_month        percent_hens    percent_eggs       source         
 Min.   :2007-12-31   Min.   : 3.20   Min.   : 9.557   Length:96         
 1st Qu.:2017-05-23   1st Qu.:13.46   1st Qu.:14.521   Class :character  
 Median :2018-11-15   Median :17.30   Median :16.235   Mode  :character  
 Mean   :2018-05-12   Mean   :17.95   Mean   :17.095                     
 3rd Qu.:2020-02-28   3rd Qu.:23.46   3rd Qu.:19.460                     
 Max.   :2021-02-28   Max.   :29.20   Max.   :24.546                     
                                      NA's   :42                         
#combine data sets by observed month
full <- full_join(egg, cage, by="observed_month")
ggplot(egg, aes(x=observed_month, y=n_eggs, color=prod_process))+geom_point()

full %>% filter(prod_type=="table eggs") %>% ggplot(aes(x=observed_month, y=n_eggs))+geom_point()

ggplot(cage, aes(x=percent_hens, y=percent_eggs))+geom_point()
Warning: Removed 42 rows containing missing values (`geom_point()`).

ggplot(cage, aes(x=observed_month, y=percent_hens))+geom_point()

ggplot(full, aes(x=prod_process, y=n_eggs))+geom_boxplot()
Warning: Removed 36 rows containing non-finite values (`stat_boxplot()`).

Questions

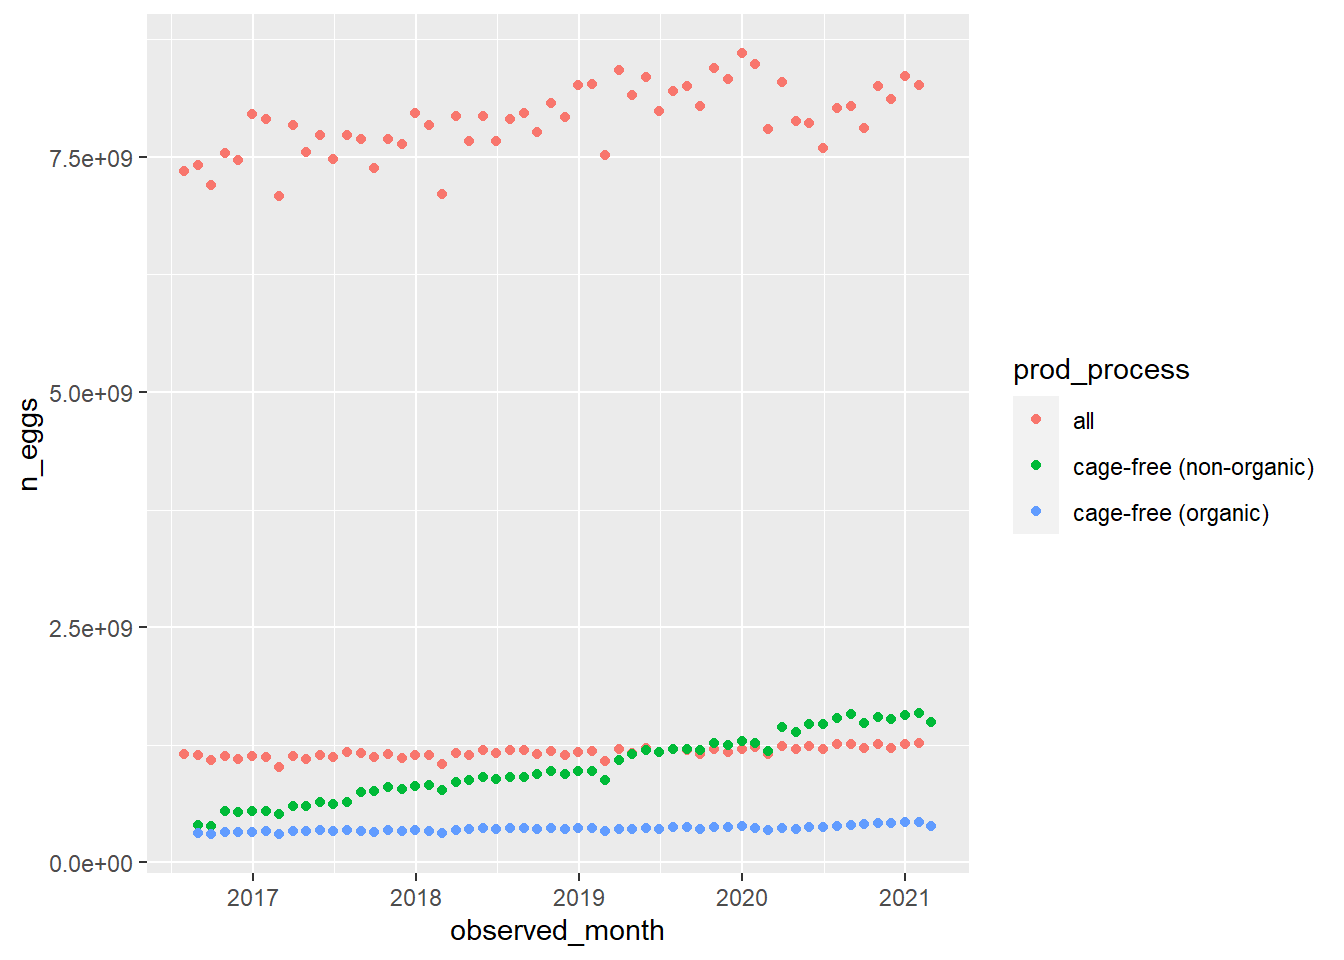
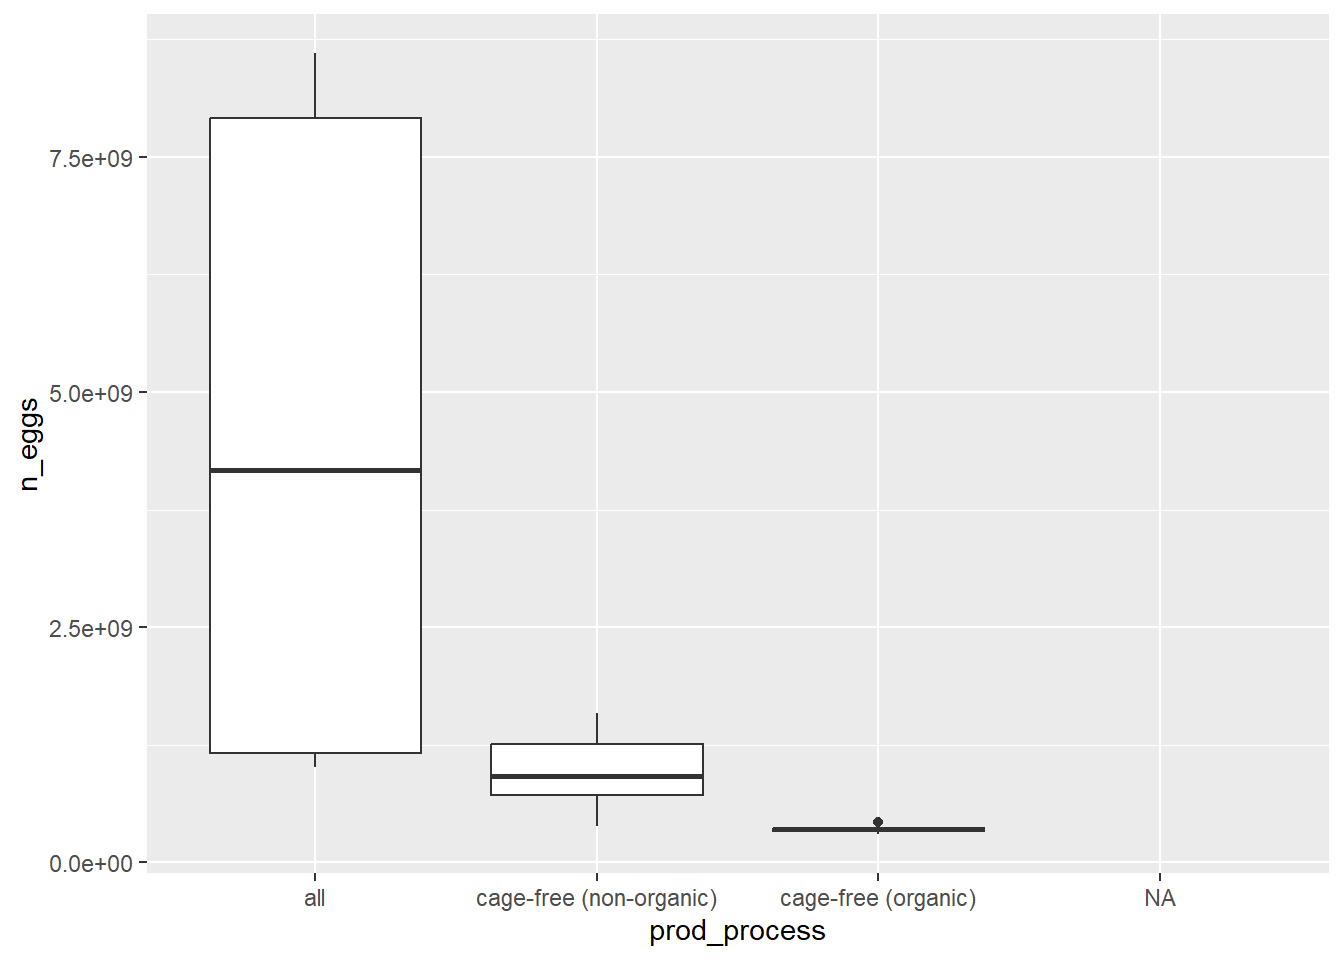
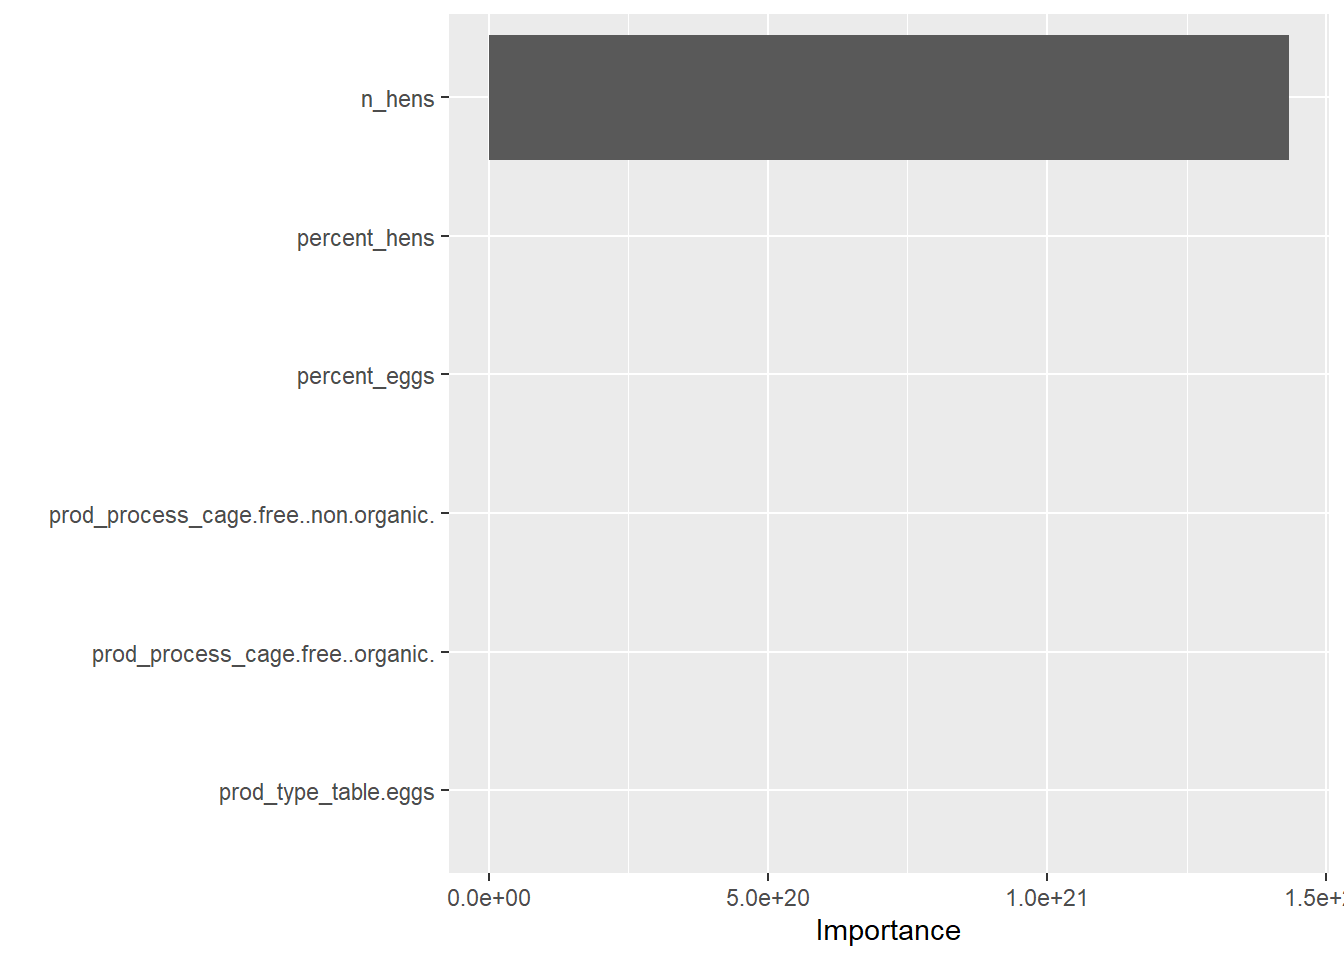
What factors are the most important for determining n_eggs produced? I want to look at how correlated various factors are with total number of eggs produced.

#removing unnecessary column
egg_prod <- full %>% select(-c(source.x,source.y, observed_month))
#change prod_type and prod_process to factor variables
egg_prod$prod_process<- as.factor(egg_prod$prod_process)
egg_prod$prod_type<- as.factor(egg_prod$prod_type)
#drop NAs
egg_prod <- egg_prod %>% drop_na()
glimpse(egg_prod)
Rows: 216
Columns: 6
$ prod_type    <fct> hatching eggs, hatching eggs, hatching eggs, hatching egg…
$ prod_process <fct> all, all, all, all, all, all, all, all, all, all, all, al…
$ n_hens       <dbl> 57595000, 57161000, 56857000, 57116000, 57750000, 5799100…
$ n_eggs       <dbl> 1142700000, 1093300000, 1126700000, 1096600000, 113290000…
$ percent_hens <dbl> 10.13569, 10.05704, 12.29353, 12.10062, 11.79349, 11.8198…
$ percent_eggs <dbl> 9.634938, 9.557439, 11.602313, 11.372893, 10.922373, 11.1…
#set seed
set.seed(123)
#data split with 70% in test data and stratified on production process
data_split <- initial_split(egg_prod, prop = 7/10, strata = prod_process) 
#specify train and test data
train_data <- training(data_split) 
test_data  <- testing(data_split)
#Cross-validation
resample<-vfold_cv(data=train_data, v=2, repeats=2, strata=prod_process)
#Recipe
egg_recipe <- 
  recipe(n_eggs ~ ., data = train_data) %>% step_dummy(prod_type, prod_process)

Null Model

#Null model
null_mod <- null_model() %>%
  set_engine("parsnip") %>%
  set_mode("regression")
#Null model recipe
null_recipe <- recipe(n_eggs ~1, train_data)
#Workflow
null_flow <- workflow() %>% add_model(null_mod) %>% add_recipe(null_recipe)
#Evaluate
null_fit <- null_flow %>% fit(data=train_data) %>% fit_resamples(resamples=resample)
! Fold1, Repeat1: internal: A correlation computation is required, but `estimate` is constant and ha...
! Fold2, Repeat1: internal: A correlation computation is required, but `estimate` is constant and ha...
! Fold1, Repeat2: internal: A correlation computation is required, but `estimate` is constant and ha...
! Fold2, Repeat2: internal: A correlation computation is required, but `estimate` is constant and ha...
null_metrics<- collect_metrics(null_fit)
null_metrics
# A tibble: 2 × 6
  .metric .estimator        mean     n   std_err .config             
  <chr>   <chr>            <dbl> <int>     <dbl> <chr>               
1 rmse    standard   3122898579.     4 37296457. Preprocessor1_Model1
2 rsq     standard          NaN      0       NA  Preprocessor1_Model1

Fitting a Tree

#Model Specification
tune_spec <- 
  decision_tree(
    cost_complexity = tune(),
    tree_depth = tune()
  ) %>% 
  set_engine("rpart") %>% 
  set_mode("regression")
#Grid specification
tree_grid <- grid_regular(cost_complexity(),
                          tree_depth(),
                          levels = 5)
#create workflow
tree_wf <- workflow() %>%
  add_model(tune_spec) %>%
  add_recipe(egg_recipe)
#Tuning grid cross validation
tree_res <- 
  tree_wf %>% 
  tune_grid(
    resamples = resample,
    grid = tree_grid
    )
#get metrics
tree_res %>% 
  collect_metrics()
# A tibble: 50 × 8
   cost_complexity tree_depth .metric .estimator      mean     n std_err .config
             <dbl>      <int> <chr>   <chr>          <dbl> <int>   <dbl> <chr>  
 1    0.0000000001          1 rmse    standard     3.80e+8     4 1.49e+7 Prepro…
 2    0.0000000001          1 rsq     standard     9.85e-1     4 8.18e-4 Prepro…
 3    0.0000000178          1 rmse    standard     3.80e+8     4 1.49e+7 Prepro…
 4    0.0000000178          1 rsq     standard     9.85e-1     4 8.18e-4 Prepro…
 5    0.00000316            1 rmse    standard     3.80e+8     4 1.49e+7 Prepro…
 6    0.00000316            1 rsq     standard     9.85e-1     4 8.18e-4 Prepro…
 7    0.000562              1 rmse    standard     3.80e+8     4 1.49e+7 Prepro…
 8    0.000562              1 rsq     standard     9.85e-1     4 8.18e-4 Prepro…
 9    0.1                   1 rmse    standard     3.80e+8     4 1.49e+7 Prepro…
10    0.1                   1 rsq     standard     9.85e-1     4 8.18e-4 Prepro…
# … with 40 more rows
#Plotting
tree_res %>% autoplot()

#Find and show best
tree_res %>%
  show_best(n=1)
Warning: No value of `metric` was given; metric 'rmse' will be used.
# A tibble: 1 × 8
  cost_complexity tree_depth .metric .estimator       mean     n std_err .config
            <dbl>      <int> <chr>   <chr>           <dbl> <int>   <dbl> <chr>  
1    0.0000000001          8 rmse    standard   183223878.     4  7.67e6 Prepro…
best_tree <- tree_res %>%
  select_best(n=1)
Warning: No value of `metric` was given; metric 'rmse' will be used.
#Finalize workflow
final_wf <- 
  tree_wf %>% 
  finalize_workflow(best_tree)
#Final fit
final_fit <- 
  final_wf %>%
  last_fit(data_split) 
#Final fit metrics
final_fit %>%
  collect_metrics()
# A tibble: 2 × 4
  .metric .estimator     .estimate .config             
  <chr>   <chr>              <dbl> <chr>               
1 rmse    standard   183805581.    Preprocessor1_Model1
2 rsq     standard           0.997 Preprocessor1_Model1
final_fit %>% collect_predictions()
# A tibble: 67 × 5
   id                     .pred  .row     n_eggs .config             
   <chr>                  <dbl> <int>      <dbl> <chr>               
 1 train/test split 1099833763.     1 1142700000 Preprocessor1_Model1
 2 train/test split 1099833763.     2 1093300000 Preprocessor1_Model1
 3 train/test split 1099833763.     3 1126700000 Preprocessor1_Model1
 4 train/test split 1099833763.    10 1138500000 Preprocessor1_Model1
 5 train/test split 1099833763.    11 1115900000 Preprocessor1_Model1
 6 train/test split 1159113333.    12 1170800000 Preprocessor1_Model1
 7 train/test split 1159113333.    19 1045600000 Preprocessor1_Model1
 8 train/test split 1159113333.    20 1166900000 Preprocessor1_Model1
 9 train/test split 1159113333.    24 1199700000 Preprocessor1_Model1
10 train/test split 1159113333.    28 1146000000 Preprocessor1_Model1
# … with 57 more rows
final_tree <- extract_workflow(final_fit)
final_tree
══ Workflow [trained] ══════════════════════════════════════════════════════════
Preprocessor: Recipe
Model: decision_tree()

── Preprocessor ────────────────────────────────────────────────────────────────
1 Recipe Step

• step_dummy()

── Model ───────────────────────────────────────────────────────────────────────
n= 149 

node), split, n, deviance, yval
      * denotes terminal node

 1) root 149 1.447027e+21 2665724000  
   2) n_hens< 1.85448e+08 111 1.809671e+19  855924700  
     4) n_hens< 3.41e+07 44 4.728557e+17  396756900  
       8) prod_process_cage.free..organic.>=0.5 37 3.559404e+16  355183400  
        16) percent_hens< 17.13295 19 5.747370e+15  332291800 *
        17) percent_hens>=17.13295 18 9.380624e+15  379346700 *
       9) prod_process_cage.free..organic.< 0.5 7 3.529383e+16  616503000 *
     5) n_hens>=3.41e+07 67 2.254932e+18 1157468000  
      10) n_hens< 4.4231e+07 14 5.375186e+16  891877900 *
      11) n_hens>=4.4231e+07 53 9.527918e+17 1227623000  
        22) percent_hens< 22.10344 38 1.080266e+17 1166379000  
          44) percent_hens< 19.73549 23 4.206504e+16 1138494000  
            88) n_hens< 5.99935e+07 8 9.983774e+15 1099834000 *
            89) n_hens>=5.99935e+07 15 1.374700e+16 1159113000 *
          45) percent_hens>=19.73549 15 2.065578e+16 1209136000 *
        23) percent_hens>=22.10344 15 3.411490e+17 1382776000 *
   3) n_hens>=1.85448e+08 38 3.367493e+18 7952242000  
     6) n_hens< 3.22724e+08 15 8.508039e+17 7699767000 *
     7) n_hens>=3.22724e+08 23 9.369506e+17 8116900000  
      14) n_hens< 3.29819e+08 13 3.858264e+17 8032408000 *
      15) n_hens>=3.29819e+08 10 3.376696e+17 8226740000 *
final_tree %>% 
  extract_fit_parsnip() %>% 
  vip()

Lasso

#Build the model
lasso_mod <- 
  linear_reg(penalty = tune(), mixture = 1) %>% 
  set_engine("glmnet")
#Create workflow
lasso_workflow <- 
  workflow() %>% 
  add_model(lasso_mod) %>% 
  add_recipe(egg_recipe)
#Create tune grid
lasso_grid <- tibble(penalty = 10^seq(-4, -1, length.out = 30))
#Find lowest penalty values
lasso_grid %>% top_n(-5)
Selecting by penalty
# A tibble: 5 × 1
   penalty
     <dbl>
1 0.0001  
2 0.000127
3 0.000161
4 0.000204
5 0.000259
#Highest penalty values
lasso_grid %>% top_n(5)
Selecting by penalty
# A tibble: 5 × 1
  penalty
    <dbl>
1  0.0386
2  0.0489
3  0.0621
4  0.0788
5  0.1   
#Train and tune model
lasso_res <- 
  lasso_workflow %>% 
  tune_grid(resample,
            grid = lasso_grid,
            control = control_grid(save_pred = TRUE),
            metrics = metric_set(rmse))
lasso_res %>% collect_metrics()
# A tibble: 30 × 7
    penalty .metric .estimator       mean     n   std_err .config              
      <dbl> <chr>   <chr>           <dbl> <int>     <dbl> <chr>                
 1 0.0001   rmse    standard   113084717.     4 11150638. Preprocessor1_Model01
 2 0.000127 rmse    standard   113084717.     4 11150638. Preprocessor1_Model02
 3 0.000161 rmse    standard   113084717.     4 11150638. Preprocessor1_Model03
 4 0.000204 rmse    standard   113084717.     4 11150638. Preprocessor1_Model04
 5 0.000259 rmse    standard   113084717.     4 11150638. Preprocessor1_Model05
 6 0.000329 rmse    standard   113084717.     4 11150638. Preprocessor1_Model06
 7 0.000418 rmse    standard   113084717.     4 11150638. Preprocessor1_Model07
 8 0.000530 rmse    standard   113084717.     4 11150638. Preprocessor1_Model08
 9 0.000672 rmse    standard   113084717.     4 11150638. Preprocessor1_Model09
10 0.000853 rmse    standard   113084717.     4 11150638. Preprocessor1_Model10
# … with 20 more rows
#Plot
lasso_res %>% autoplot()

#Select best performing model
lasso_res %>% show_best()
# A tibble: 5 × 7
   penalty .metric .estimator       mean     n   std_err .config              
     <dbl> <chr>   <chr>           <dbl> <int>     <dbl> <chr>                
1 0.0001   rmse    standard   113084717.     4 11150638. Preprocessor1_Model01
2 0.000127 rmse    standard   113084717.     4 11150638. Preprocessor1_Model02
3 0.000161 rmse    standard   113084717.     4 11150638. Preprocessor1_Model03
4 0.000204 rmse    standard   113084717.     4 11150638. Preprocessor1_Model04
5 0.000259 rmse    standard   113084717.     4 11150638. Preprocessor1_Model05
best_lasso<-lasso_res %>% select_best(method="rmse")
best_lasso
# A tibble: 1 × 2
  penalty .config              
    <dbl> <chr>                
1  0.0001 Preprocessor1_Model01
#Final workflow
lasso_final<-lasso_workflow %>% finalize_workflow(best_lasso)
#Final fit
lasso_final_fit<-lasso_final %>% fit(train_data)
#Plot
x <- extract_fit_engine(lasso_final_fit)
plot(x, "lambda")

Random Forest

#Build model
cores <- parallel::detectCores()
cores
[1] 4
rf_mod <- 
  rand_forest(mtry = tune(), min_n = tune(), trees = 1000) %>% 
  set_engine("ranger", num.threads = cores, importance="impurity") %>% 
  set_mode("regression")
#Create workflow
rf_workflow <- 
  workflow() %>% 
  add_model(rf_mod) %>% 
  add_recipe(egg_recipe)
#Parameters for tuning
extract_parameter_set_dials(rf_mod)
Collection of 2 parameters for tuning

 identifier  type    object
       mtry  mtry nparam[?]
      min_n min_n nparam[+]

Model parameters needing finalization:
   # Randomly Selected Predictors ('mtry')

See `?dials::finalize` or `?dials::update.parameters` for more information.
#Tune grid
rf_res <- 
  rf_workflow %>% 
  tune_grid(resample,
            grid = 25,
            control = control_grid(save_pred = TRUE),
            metrics = NULL)
i Creating pre-processing data to finalize unknown parameter: mtry
#Find and show best
rf_res %>% show_best()
Warning: No value of `metric` was given; metric 'rmse' will be used.
# A tibble: 5 × 8
   mtry min_n .metric .estimator       mean     n   std_err .config             
  <int> <int> <chr>   <chr>           <dbl> <int>     <dbl> <chr>               
1     6    12 rmse    standard   143633321.     4 12615726. Preprocessor1_Model…
2     5     2 rmse    standard   144446555.     4  8741680. Preprocessor1_Model…
3     5    18 rmse    standard   148439667.     4 15694610. Preprocessor1_Model…
4     4     5 rmse    standard   154617409.     4 19823256. Preprocessor1_Model…
5     5    22 rmse    standard   156730073.     4 15958173. Preprocessor1_Model…
rf_best <- rf_res %>% select_best()
Warning: No value of `metric` was given; metric 'rmse' will be used.
#Final workflow
rf_final_wf<- rf_workflow%>% finalize_workflow(rf_best)
#Final fit
rf_final <- rf_final_wf %>% fit(train_data)
rf_final %>% extract_fit_parsnip() %>% vip(num_features=28)

fx <- extract_fit_engine(rf_final)
vip(fx)

Fitting Test Data

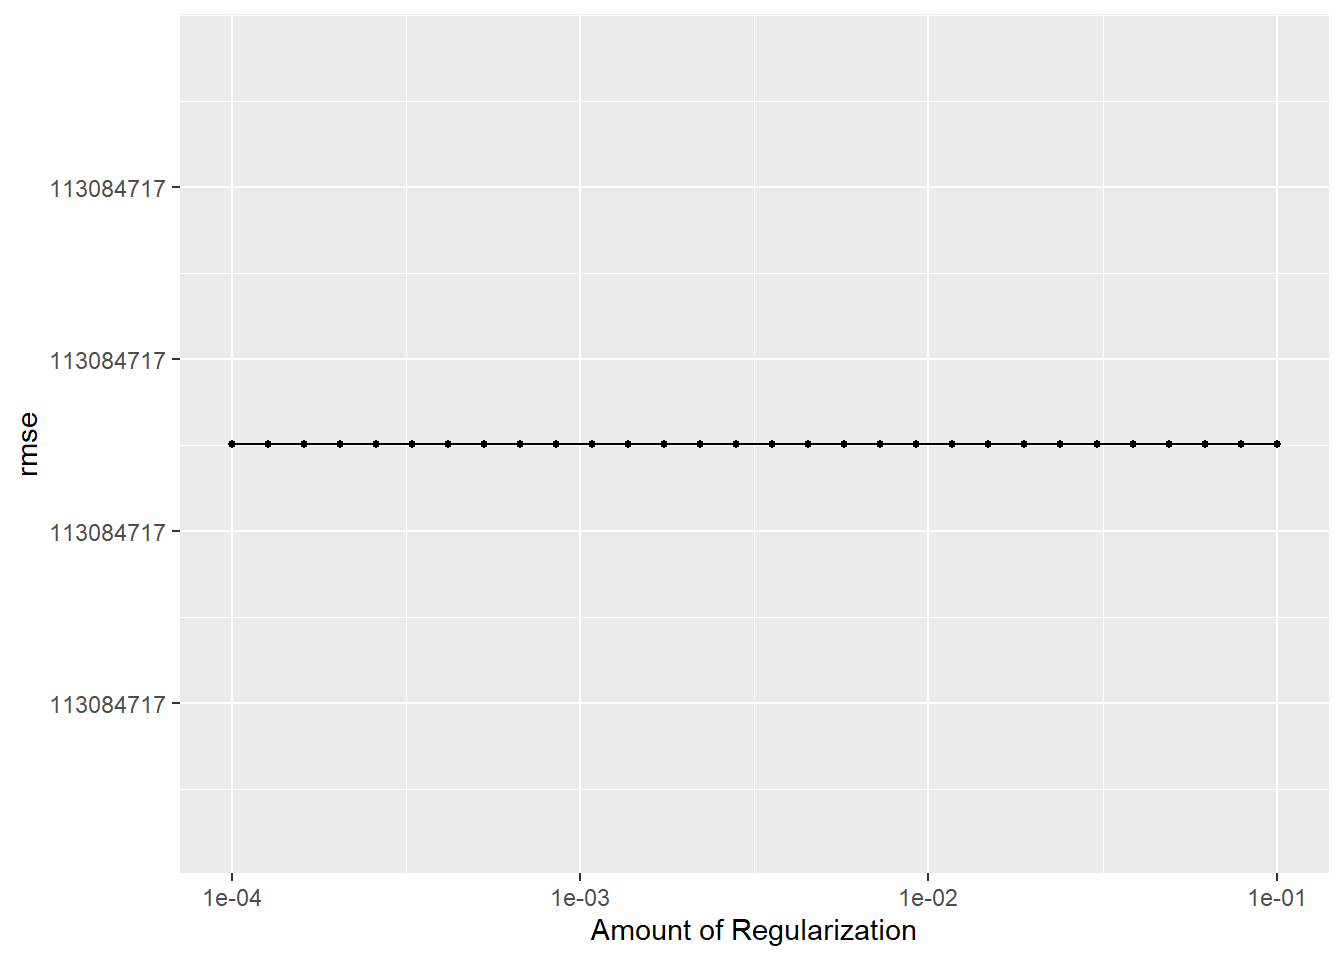
I decided to choose the random forest model because I wanted to have a little more practice with it and because the rmse values for the models were fairly close.

final_test <- rf_final %>% last_fit(data_split)
final_test %>% collect_metrics()
# A tibble: 2 × 4
  .metric .estimator     .estimate .config             
  <chr>   <chr>              <dbl> <chr>               
1 rmse    standard   162700995.    Preprocessor1_Model1
2 rsq     standard           0.997 Preprocessor1_Model1