Tidy Tuesday Exercise

This data is the TidyTuesday data shared for this week of 2023-02-14. It contains information on the age gaps between actors portraying a romantic relationship in 1155 Hollywood movies. The data can be found through the TidyTuesday github repository at https://github.com/rfordatascience/tidytuesday/tree/master/data/2023/2023-02-14.

Load Packages

library(tidyverse)
── Attaching packages ─────────────────────────────────────── tidyverse 1.3.2 ──
✔ ggplot2 3.4.0      ✔ purrr   1.0.1 
✔ tibble  3.1.8      ✔ dplyr   1.0.10
✔ tidyr   1.2.1      ✔ stringr 1.5.0 
✔ readr   2.1.3      ✔ forcats 0.5.2 
── Conflicts ────────────────────────────────────────── tidyverse_conflicts() ──
✖ dplyr::filter() masks stats::filter()
✖ dplyr::lag()    masks stats::lag()
library(plotly)

Attaching package: 'plotly'

The following object is masked from 'package:ggplot2':

    last_plot

The following object is masked from 'package:stats':

    filter

The following object is masked from 'package:graphics':

    layout

Load Data

tuesdata <- tidytuesdayR::tt_load('2023-02-14')
--- Compiling #TidyTuesday Information for 2023-02-14 ----
--- There is 1 file available ---
--- Starting Download ---

    Downloading file 1 of 1: `age_gaps.csv`
--- Download complete ---
age_gaps <- tuesdata$age_gaps

Explore Data

str(age_gaps)
spc_tbl_ [1,155 × 13] (S3: spec_tbl_df/tbl_df/tbl/data.frame)
 $ movie_name        : chr [1:1155] "Harold and Maude" "Venus" "The Quiet American" "The Big Lebowski" ...
 $ release_year      : num [1:1155] 1971 2006 2002 1998 2010 ...
 $ director          : chr [1:1155] "Hal Ashby" "Roger Michell" "Phillip Noyce" "Joel Coen" ...
 $ age_difference    : num [1:1155] 52 50 49 45 43 42 40 39 38 38 ...
 $ couple_number     : num [1:1155] 1 1 1 1 1 1 1 1 1 1 ...
 $ actor_1_name      : chr [1:1155] "Ruth Gordon" "Peter O'Toole" "Michael Caine" "David Huddleston" ...
 $ actor_2_name      : chr [1:1155] "Bud Cort" "Jodie Whittaker" "Do Thi Hai Yen" "Tara Reid" ...
 $ character_1_gender: chr [1:1155] "woman" "man" "man" "man" ...
 $ character_2_gender: chr [1:1155] "man" "woman" "woman" "woman" ...
 $ actor_1_birthdate : Date[1:1155], format: "1896-10-30" "1932-08-02" ...
 $ actor_2_birthdate : Date[1:1155], format: "1948-03-29" "1982-06-03" ...
 $ actor_1_age       : num [1:1155] 75 74 69 68 81 59 62 69 57 77 ...
 $ actor_2_age       : num [1:1155] 23 24 20 23 38 17 22 30 19 39 ...
 - attr(*, "spec")=
  .. cols(
  ..   movie_name = col_character(),
  ..   release_year = col_double(),
  ..   director = col_character(),
  ..   age_difference = col_double(),
  ..   couple_number = col_double(),
  ..   actor_1_name = col_character(),
  ..   actor_2_name = col_character(),
  ..   character_1_gender = col_character(),
  ..   character_2_gender = col_character(),
  ..   actor_1_birthdate = col_date(format = ""),
  ..   actor_2_birthdate = col_date(format = ""),
  ..   actor_1_age = col_double(),
  ..   actor_2_age = col_double()
  .. )
 - attr(*, "problems")=<externalptr> 
summary(age_gaps)
  movie_name         release_year    director         age_difference 
 Length:1155        Min.   :1935   Length:1155        Min.   : 0.00  
 Class :character   1st Qu.:1997   Class :character   1st Qu.: 4.00  
 Mode  :character   Median :2004   Mode  :character   Median : 8.00  
                    Mean   :2001                      Mean   :10.42  
                    3rd Qu.:2012                      3rd Qu.:15.00  
                    Max.   :2022                      Max.   :52.00  
 couple_number   actor_1_name       actor_2_name       character_1_gender
 Min.   :1.000   Length:1155        Length:1155        Length:1155       
 1st Qu.:1.000   Class :character   Class :character   Class :character  
 Median :1.000   Mode  :character   Mode  :character   Mode  :character  
 Mean   :1.398                                                           
 3rd Qu.:2.000                                                           
 Max.   :7.000                                                           
 character_2_gender actor_1_birthdate    actor_2_birthdate     actor_1_age   
 Length:1155        Min.   :1889-04-16   Min.   :1906-10-06   Min.   :18.00  
 Class :character   1st Qu.:1953-05-16   1st Qu.:1965-03-25   1st Qu.:33.00  
 Mode  :character   Median :1964-10-03   Median :1974-07-30   Median :39.00  
                    Mean   :1960-09-07   Mean   :1971-01-29   Mean   :40.64  
                    3rd Qu.:1973-08-07   3rd Qu.:1982-04-07   3rd Qu.:47.00  
                    Max.   :1996-06-01   Max.   :1996-11-11   Max.   :81.00  
  actor_2_age   
 Min.   :17.00  
 1st Qu.:25.00  
 Median :29.00  
 Mean   :30.21  
 3rd Qu.:34.00  
 Max.   :68.00  
glimpse(age_gaps)
Rows: 1,155
Columns: 13
$ movie_name         <chr> "Harold and Maude", "Venus", "The Quiet American", …
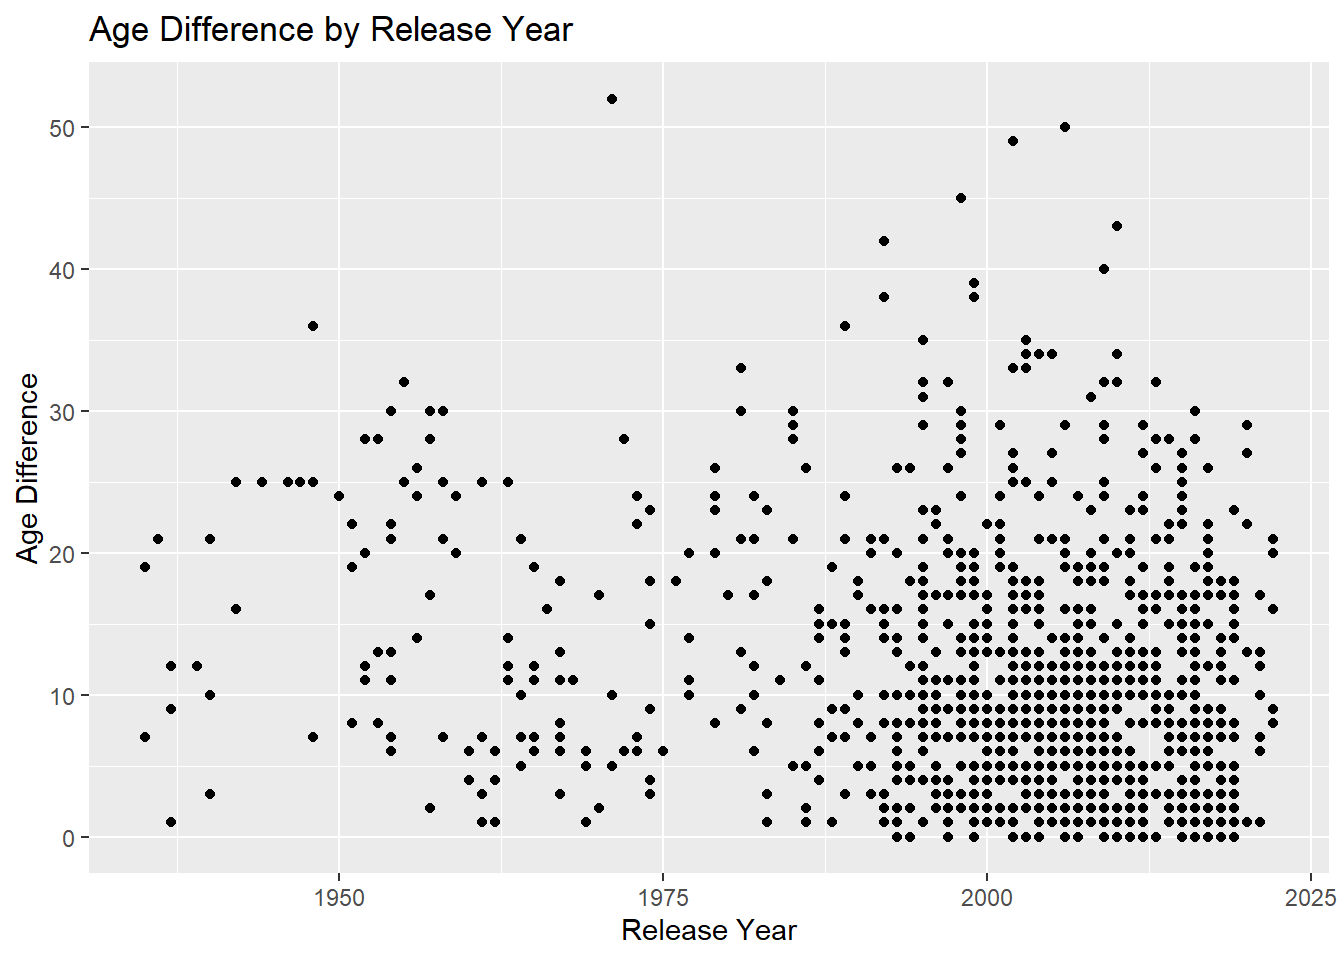
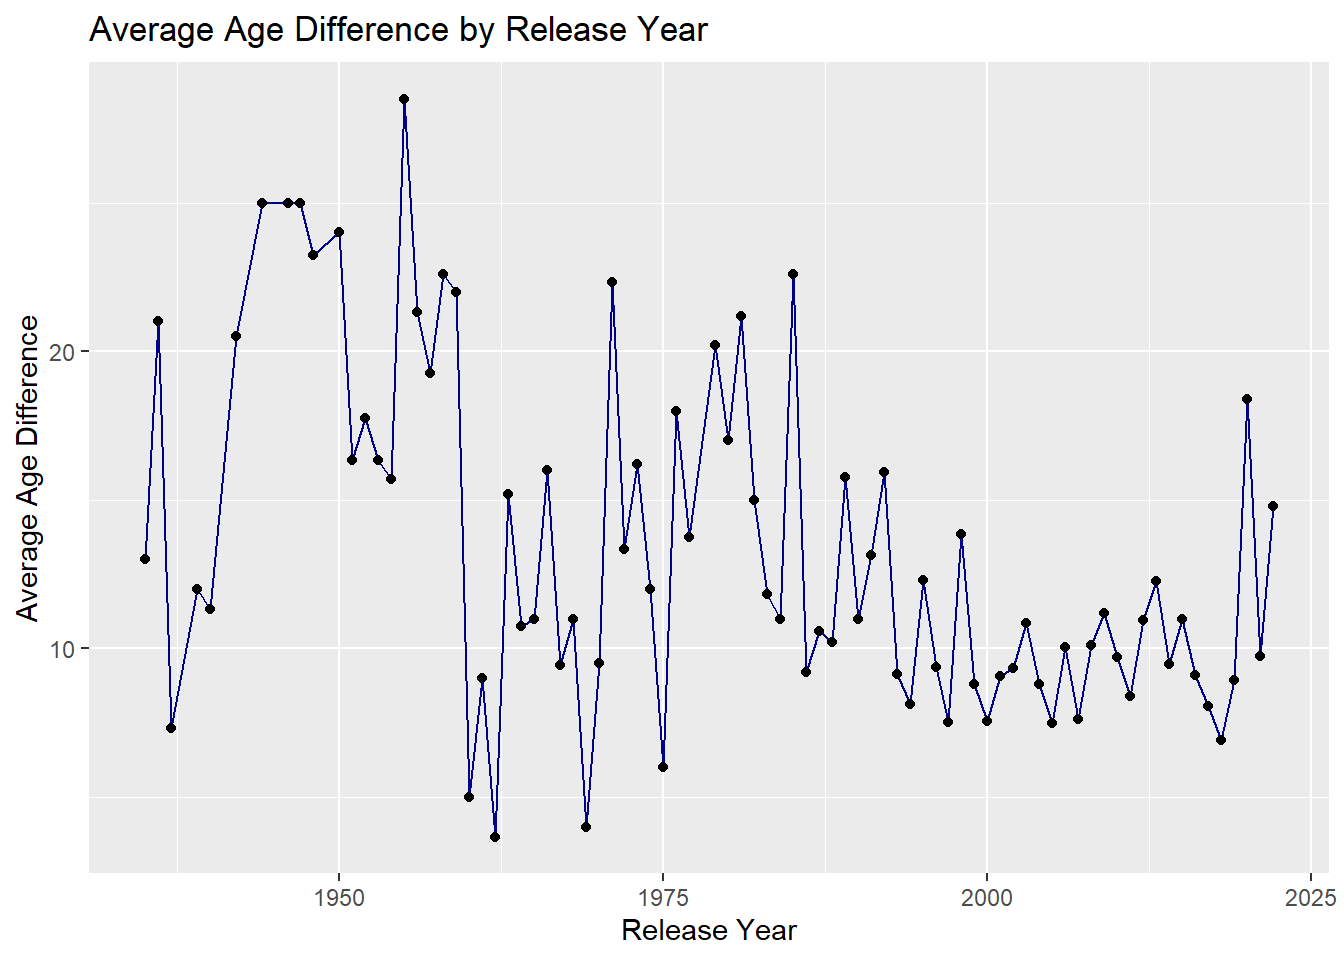
$ release_year       <dbl> 1971, 2006, 2002, 1998, 2010, 1992, 2009, 1999, 199…
$ director           <chr> "Hal Ashby", "Roger Michell", "Phillip Noyce", "Joe…
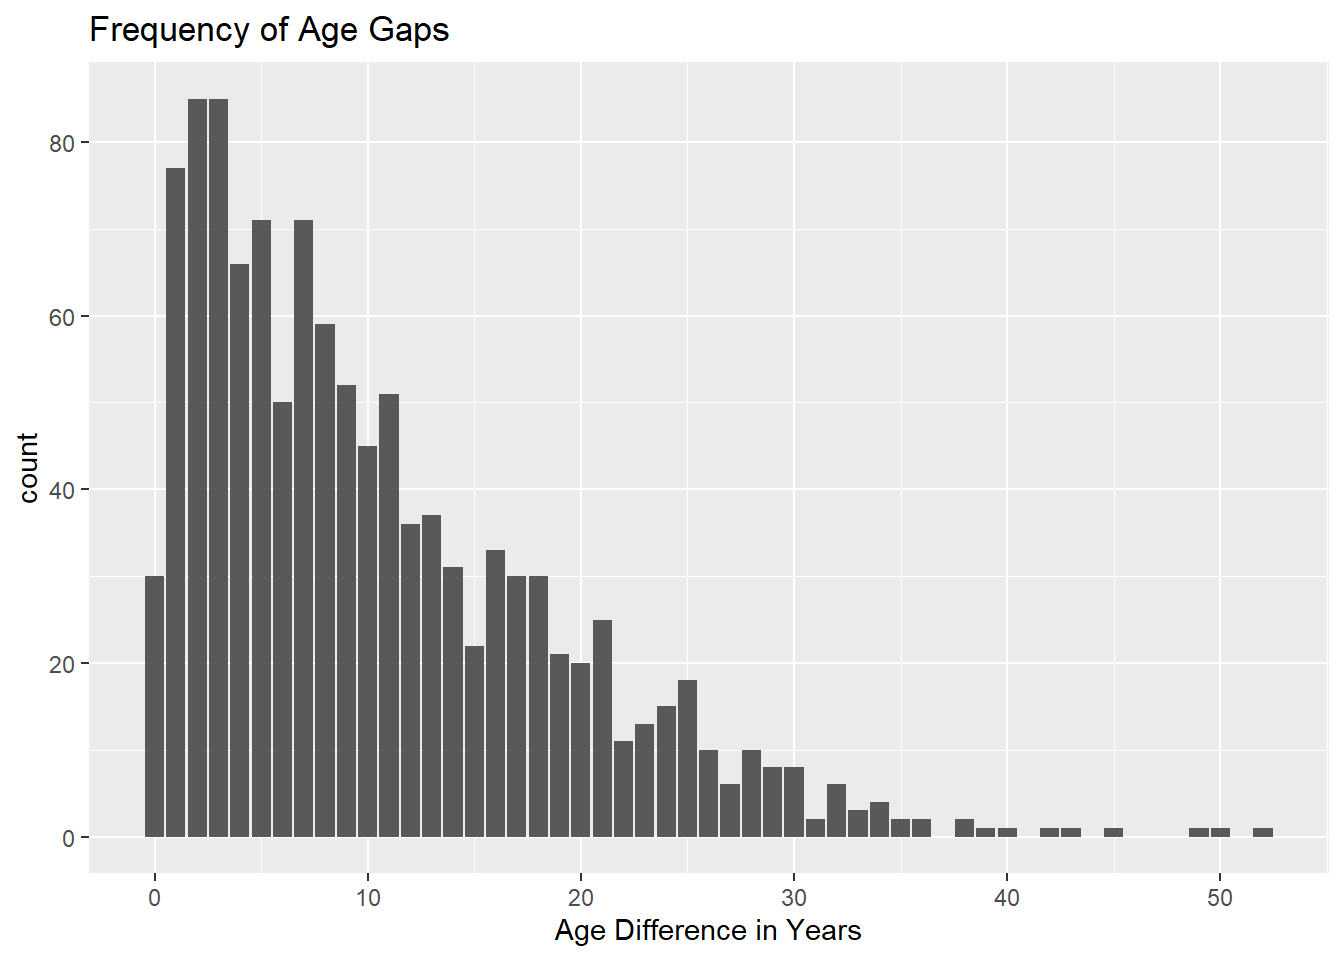
$ age_difference     <dbl> 52, 50, 49, 45, 43, 42, 40, 39, 38, 38, 36, 36, 35,…
$ couple_number      <dbl> 1, 1, 1, 1, 1, 1, 1, 1, 1, 1, 1, 1, 1, 1, 1, 1, 1, …
$ actor_1_name       <chr> "Ruth Gordon", "Peter O'Toole", "Michael Caine", "D…
$ actor_2_name       <chr> "Bud Cort", "Jodie Whittaker", "Do Thi Hai Yen", "T…
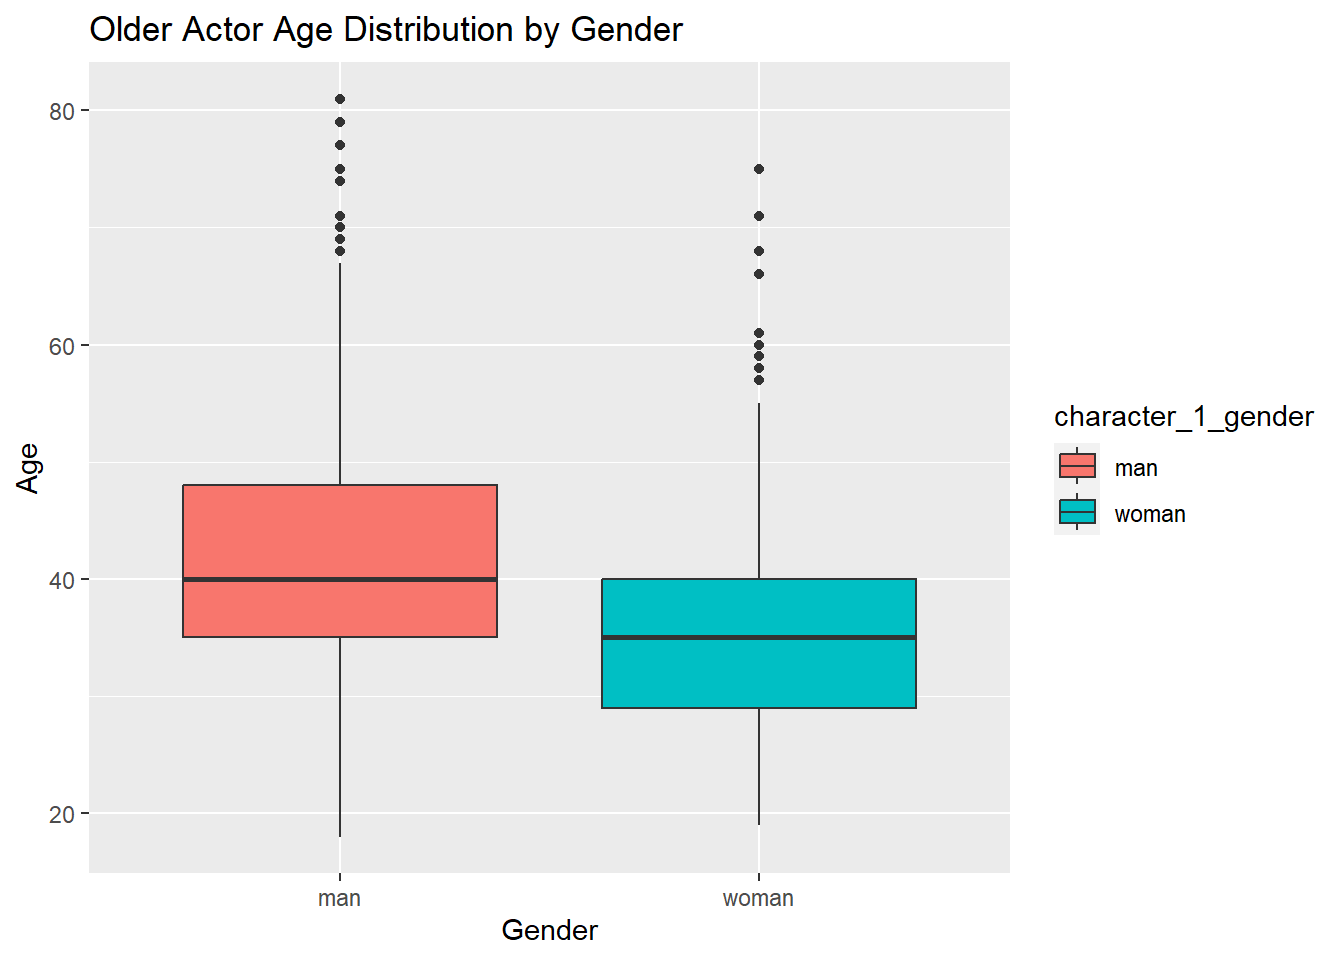
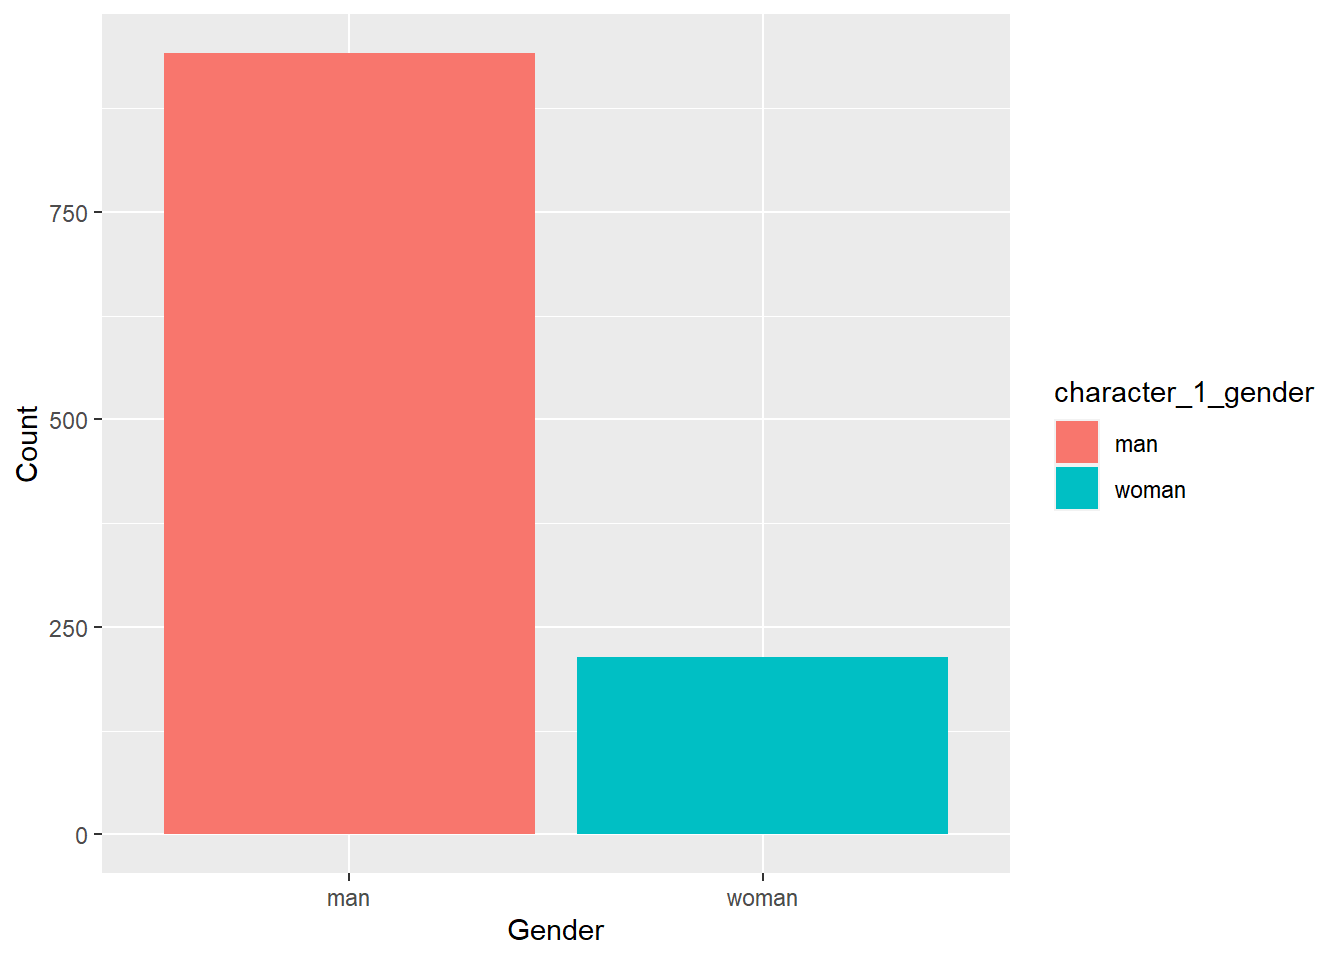
$ character_1_gender <chr> "woman", "man", "man", "man", "man", "man", "man", …
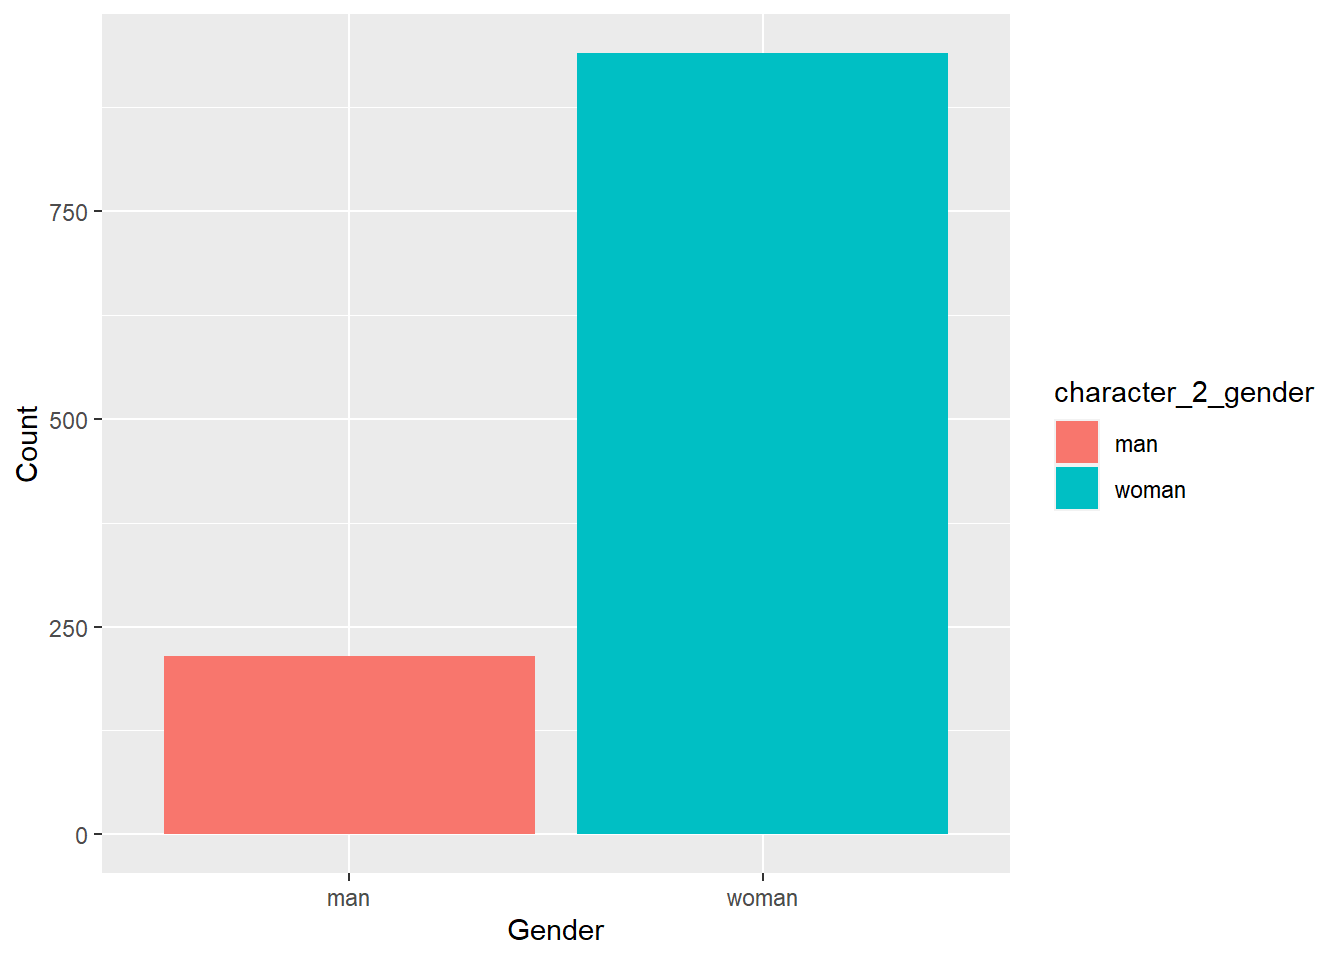
$ character_2_gender <chr> "man", "woman", "woman", "woman", "man", "woman", "…
$ actor_1_birthdate  <date> 1896-10-30, 1932-08-02, 1933-03-14, 1930-09-17, 19…
$ actor_2_birthdate  <date> 1948-03-29, 1982-06-03, 1982-10-01, 1975-11-08, 19…
$ actor_1_age        <dbl> 75, 74, 69, 68, 81, 59, 62, 69, 57, 77, 59, 56, 65,…
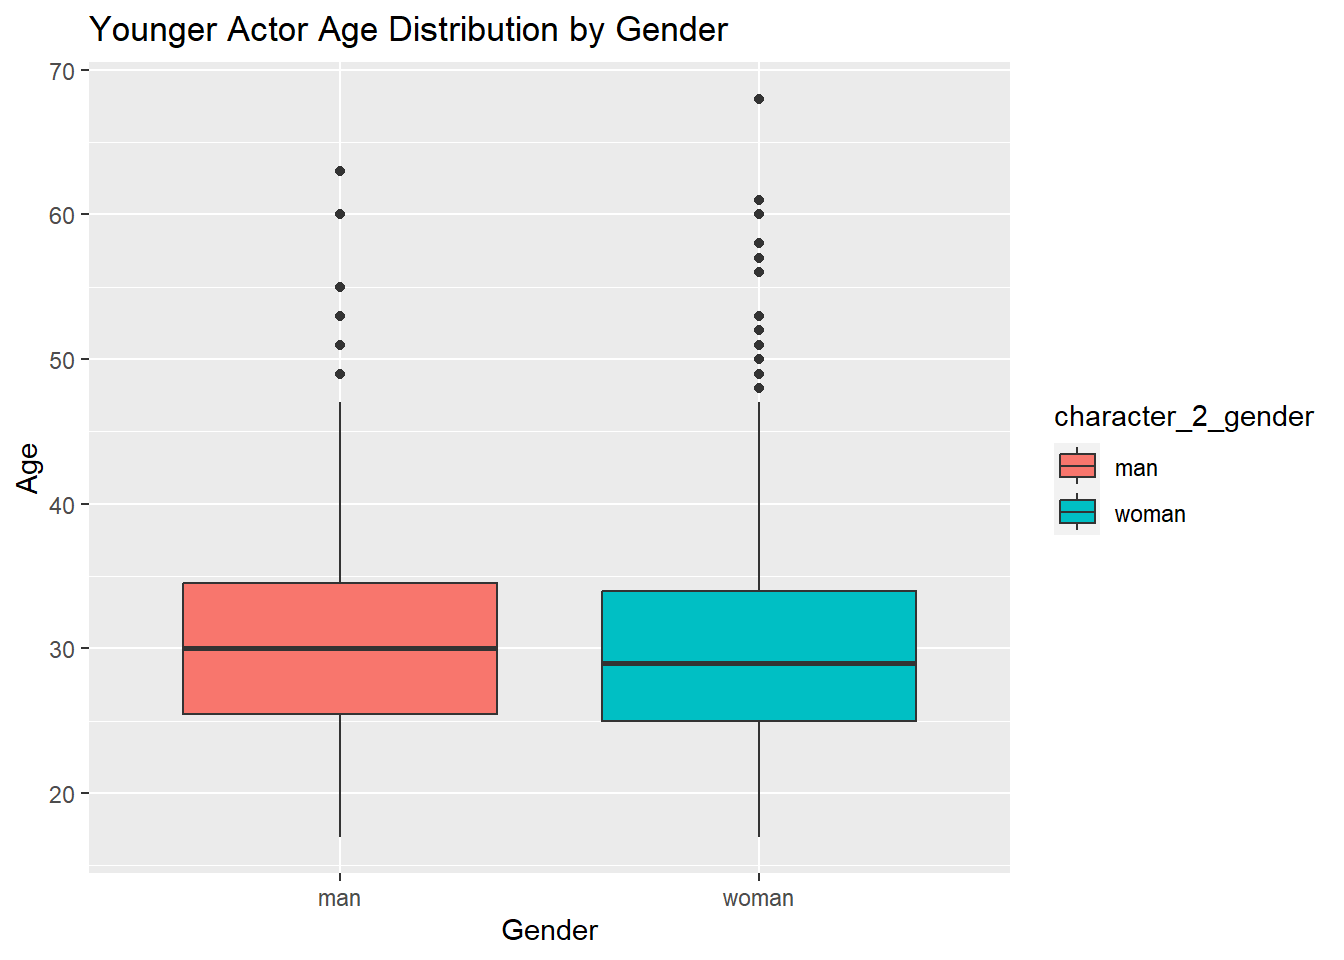
$ actor_2_age        <dbl> 23, 24, 20, 23, 38, 17, 22, 30, 19, 39, 23, 20, 30,…

Next I will check for any missing variables in the dataset.

anyNA(age_gaps)
[1] FALSE

There is no missing data.

Here I did a basic scatter plot to see the age different by release year.

scatter<- ggplot(age_gaps, aes(x=release_year, y=age_difference, text= paste(movie_name, "<br>"))) + geom_point()+
  labs(title="Age Difference by Release Year")+xlab("Release Year")+ylab("Age Difference")
scatter

Overall there were more recent movies in the data than older movies, which may partially skew the age gap distributions just from having less data to work from for the pre 1980’s movies. I wanted to try to make the graph interactive with a hover box with the movie title just for practice.

library(plotly)
ggplotly(scatter, tooltip=c("text"))

I decided to make another graph to see the average age gap each release year to hopefully get more clarity.

avg <-age_gaps %>% group_by(release_year) %>% summarize(year_avg = mean(age_difference))
ggplot(avg, aes(x=release_year, y=year_avg))+ geom_line(color="dark blue")+geom_point()+xlab("Release Year")+ylab("Average Age Difference")+labs(title="Average Age Difference by Release Year")

This graph with the average age differences by year shows that the older movies tended to have a larger age gap on average between the actors, but there doesn’t appear to be a super strong trend.

ggplot(age_gaps, aes(x=age_difference))+ geom_bar()+labs(title="Frequency of Age Gaps")+xlab("Age Difference in Years")

From this distribution it seems most of the movies had age differences of less than 10 years, with the frequency steadily decreasing the larger the age gap became.

The first actor is the older one in the data set, so I decided to look at the age distribution by gender for the older actors and compare it to the younger ones.

box1<-ggplot(age_gaps, aes(x=character_1_gender, y=actor_1_age))+geom_boxplot(aes(fill=character_1_gender))+
  xlab("Gender")+ylab("Age")+
  labs(title="Older Actor Age Distribution by Gender")
box1

box2<-ggplot(age_gaps, aes(x=character_2_gender, y=actor_2_age))+geom_boxplot(aes(fill=character_2_gender))+labs(title="Younger Actor Age Distribution by Gender")+xlab("Gender")+ylab("Age")
box2

It seems that for the older actors in the age difference pairs that the men had an older age distribution than the women while it was relatively the same for the younger actors in the pairs. I then want to see if the older actors were typically one gender or the other.

actor1bar<-ggplot(age_gaps, aes(x=character_1_gender))+geom_bar(aes(fill=character_1_gender))+xlab("Gender")+ylab("Count")
actor1bar

age_gaps %>% pull(character_1_gender) %>% table()
.
  man woman 
  941   214 

The bar graph showed that the large majority of the older actors were men so I checked the actual numbers and found out that 941 were men and 214 were women.

actor2bar<-ggplot(age_gaps, aes(x=character_2_gender))+geom_bar(aes(fill=character_2_gender))+xlab("Gender")+ylab("Count")
actor2bar

age_gaps %>% pull(character_2_gender) %>% table()
.
  man woman 
  215   940 

The frequency is reversed for the younger actors with the majority of them being women with 940 women and 215 men. This the made me wonder how many non-heterosexual pairings there were.

mm<- age_gaps %>% filter(character_1_gender=="man") %>% filter(character_2_gender=="man") %>% count()
ff<- age_gaps %>% filter(character_1_gender=="woman") %>% filter(character_2_gender=="woman") %>% count()
mm
# A tibble: 1 × 1
      n
  <int>
1    12
ff
# A tibble: 1 × 1
      n
  <int>
1    11

There appears to be 12 movies with both actors being male and 11 with both actors being female.

I’m now kind of curious about which movie had the largest age gap and also which had the smallest.

age_gaps %>% pull(age_difference) %>% range()
[1]  0 52
age_gaps %>% filter(age_difference==52)
# A tibble: 1 × 13
  movie_name     relea…¹ direc…² age_d…³ coupl…⁴ actor…⁵ actor…⁶ chara…⁷ chara…⁸
  <chr>            <dbl> <chr>     <dbl>   <dbl> <chr>   <chr>   <chr>   <chr>  
1 Harold and Ma…    1971 Hal As…      52       1 Ruth G… Bud Co… woman   man    
# … with 4 more variables: actor_1_birthdate <date>, actor_2_birthdate <date>,
#   actor_1_age <dbl>, actor_2_age <dbl>, and abbreviated variable names
#   ¹​release_year, ²​director, ³​age_difference, ⁴​couple_number, ⁵​actor_1_name,
#   ⁶​actor_2_name, ⁷​character_1_gender, ⁸​character_2_gender
age_gaps %>% filter(age_difference==0)
# A tibble: 30 × 13
   movie_name    relea…¹ direc…² age_d…³ coupl…⁴ actor…⁵ actor…⁶ chara…⁷ chara…⁸
   <chr>           <dbl> <chr>     <dbl>   <dbl> <chr>   <chr>   <chr>   <chr>  
 1 10 Things I …    1999 Gil Ju…       0       2 Joseph… Larisa… man     woman  
 2 A Happening …    2017 Judy G…       0       2 Common  Jennif… man     woman  
 3 A Simple Fav…    2018 Paul F…       0       2 Henry … Blake … man     woman  
 4 American Hus…    2013 David …       0       3 Christ… Amy Ad… man     woman  
 5 American Pie     1999 Paul W…       0       4 Mena S… Chris … woman   man    
 6 Blue Valenti…    2010 Derek …       0       1 Michel… Ryan G… woman   man    
 7 Catch Me If …    2002 Steven…       0       1 Amy Ad… Leonar… woman   man    
 8 Chicago          2002 Rob Ma…       0       2 Renee … Domini… woman   man    
 9 Daddy's Litt…    2007 Tyler …       0       1 Idris … Gabrie… man     woman  
10 Empire           2002 Franc.…       0       2 Denise… Peter … woman   man    
# … with 20 more rows, 4 more variables: actor_1_birthdate <date>,
#   actor_2_birthdate <date>, actor_1_age <dbl>, actor_2_age <dbl>, and
#   abbreviated variable names ¹​release_year, ²​director, ³​age_difference,
#   ⁴​couple_number, ⁵​actor_1_name, ⁶​actor_2_name, ⁷​character_1_gender,
#   ⁸​character_2_gender

The movie with the age difference of 52 was Harold and Maude released in 1971. However there were 30 movies where the age difference was not even an entire year.